Section Four - Apophenia
A story about a rabbit in the clouds, Jesus on Toast and a Flying Spaghetti Monster (7 minutes)
Apophenia
Have you ever seen a rabbit in the clouds?

Yes? Did it make you wonder if there was a higher being somewhere that tried to communicate with you by showing you a rabbit? Or did you think it was a coincidence?
The woman in the video below (1 minute) saw Jesus in cheese toast.
She thought it was not a coincidence, but it probably was. In the United States people see the image of Jesus everywhere. In a puddle of oil or in toasted bread. At least 200 times a year. Unfortunately, since 2011 you can also buy toasters that print Jesus in your bread, which of course kills the magic.

Also, people never see the image of Jesus on toast in the Middle East.
A rabbit in the clouds. Jesus on toast. These are examples of apophenia: the tendency to mistakenly perceive meaningful connections between unrelated things. Apophenia is also used in the Holtzman Inkblot Test where people have to recognize things in inkblots
Apophenia in Big Data
Apophenia is a phenomenon you also see in Big Data.
In fact, if you have enough data, you will always find convincing correlations everywhere. But these relations are often a coincidence. There is no real relation There is certainly no causality. Just for the non-statisticians among us (like me): correlation is when two variables show coherence in an orderly manner. Causality is a cause-and-effect relationship. If you have 'intelligent' software that looks for correlations (data mining software) then you will find more and more patterns (correlations).
But, which correlations are meaningful? Which are just a rabbit in the clouds?
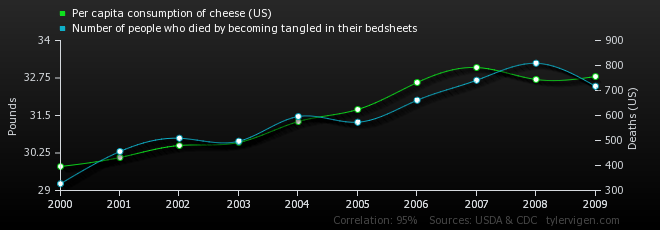
Tyler Vigen’s Spurious Correlations website features all sorts of great examples. My favourite (and I’m not alone in that) is the correlation between cheese consumption per capita and the number of people dying from getting caught in the bed sheets.
 (Image from Tylervigen.com)
So now you have to think. Maybe if people eat too much cheese, there sleep is becoming restless, they move and turn, they get caught in the bed sheets and then they die. Or maybe it is just Jesus on toast!
Another highlight of Tyler Vigen is the compelling correlation between the number of people drowning in a pool and the number of films Nicholas Cage stars in. So, does this mean that, if Nicholas Cage takes a year off, you no longer have to watch your children at the pool? Probably not.
Certainly, because correlation in data does not mean that it is not a coincidence, you need more than (big) data to determine what is going on. You also need common sense and an understanding of the phenomenon you’re looking at. The more data there is, the more important it becomes.
Now watch this 3 minute video with some examples of the master of spurious correlations Tyler Vigen:
Church of the flying spaghetti monster
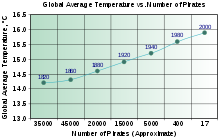
The Church of the Flying Spaghetti Monster (FSM) first surfaced in 2005 in a letter by Bobby Henderson. FSM is a social movement that promotes a light-hearted view of religion. In his letter Henderson also stated that Pirates are divine beings. They are the original Pastafarians. The inclusion of pirates in Pastafarianism (FSM) was part of Henderson's original letter to the Kansas State Board of Education, in an effort to illustrate that correlation does not imply causation.
Henderson presented the argument that "global warming, earthquakes, hurricanes, and other natural disasters are a direct effect of the shrinking numbers of pirates since the 1800s." A deliberately misleading graph accompanying the letter (with numbers humorously disordered on the x-axis) shows that as the number of pirates decreased, global temperatures increased.

This parodies the suggestion from some religious groups that the high numbers of disasters, famines, and wars in the world is due to the lack of respect and worship toward their deity.
In 2008, Henderson interpreted the growing pirate activities at the Gulf of Aden as additional support, pointing out that Somalia has "the highest number of pirates and the lowest carbon emissions of any country."
"Torture the data and it will confess to anything" - Ronald Coase
Take aways from section four:
- More data and better data mining software means finding more patterns/correlations;
- These correlations can and will often be just a coincidence;
- So data scientist need to understand the phenomenon they are looking at;
- And we need to stop killing pirates.
Note: This all sounds easy, but it really is not. In section six, we have created a fun exercises for you to experience it yourself.
